.svg "ConversionCrew_color (1)")
.svg "ConversionCrew_white (1)")
Every HubSpot portal needs a good set of reports and dashboard to measure performance and monitor the current state of data you work with. For HubSpot Admins it has become extremely important to translate the findings in their CRM to meaningful insights about their target group and customers. In this blog, I am diving in a few ways to help HubSpot Admins get up and running with reporting in HubSpot.
This blog will cover three main reporting components in your HubSpot Environment:
- CRM reports
- Sales analytics
- Website analytics
Finding your way in the report builder
First things first: HubSpot has a library with over 200 standard reports, ready for you to use. Isn't that just great? Generic reports - to be used by all HubSpot Admins - include basic overviews of contacts created or won deals. And much more!
Diving into HubSpot's report builder isn't necessarily the easiest job for a HubSpot Admin. There are a lot of reports to explore, or create. So let's take a look at where to begin.
Standard reports
One can navigate to the standard reports in HubSpot using Reporting > Reports > My Reports. An overview of all reports created by you or your co-workers can be found there.
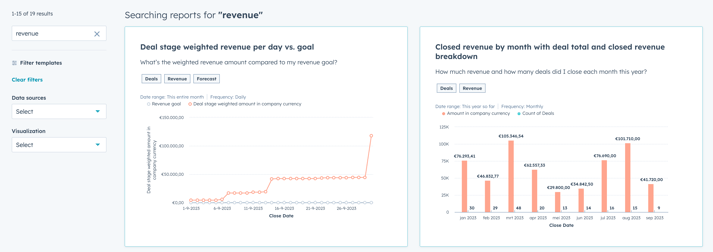
Upon creating a new report, HubSpot's default search function allows you to explore their extensive library of useful, practical and even in-depth reports that you can add to your personal views. It's plug and play, really.
Using the custom report builder
You can take data analysis to the next step in HubSpot by utilizing the custom report builder. This report builder allows for a wider variety of options when it comes to visualizing data.
How it works? An enormous advantage of custom reports is the inclusion of multiple objects. These reports are ideal if you would like to visualize company segments by using filters of deals that are associated.
This also relates to an important rule of thumb when working with custom reports: when choosing multiple data sources, the primary data source means all records within this object. The secondary source(s) selected will display all associated object information.
In other words: all companies, and all deals associated to those companies. Deals that are not associated with a company, are not shown in the report you are working with.
Analyzing your sales performance
What has always been known as Sales Analytics can now in HubSpot be found under Reporting > Reports > Sales. This reporting environment gives you a wide range of tools and reports that help you understand the current state of your sales department.
User and team activities
For sales ops and managers it is critical to understand how the sales teams are performing. Are the number of logged calls and meetings in accordance with our weekly targets? Do we know if the number of deals created will lead to our forecasted amounts?
The answer to these - and more - questions can be found in the Sales Analytics environment.
Moving through the deal pipeline
It helps sales managers understand how fast (or slowly) deals are moving through the deal stages. Per sales rep or team, you might want to understand where to encounter potential hiccups in your sales process.
In addition to getting more understanding on the time that deals spend in certain stages, this part of the Sales Analytics environment also provides more insights on the number of deals created in a given period.
Diving into your website performance
If you've got the HubSpot tracking code installed on your website, this area in HubSpot is your number one place to be. What we know as the Traffic Analytics section can now be found by navigating to Reporting > Reports > Websites.
This section in the reporting environment helps you understand your website traffic in a total of six different areas:
- The source of your website visitors
- Your most (and least) popular pages
- UTM parameters
- Devices your visitors are using
- Countries your visitors are browsing from
- Browsers your website visitors are using
You can use a large number of filters to make the data easy on the eye. I personally like the following two rolling date ranges in combination with the appropriate reporting frequency:
- Last 60 days, weekly
- Last 365 days, monthly
Are you particularly interested in a detailed section of your website? Then use custom analytics views to specify your reports and make it easier to interpret your analytics information.
So, where to go next?
If you're starting as a HubSpot Admin, there are various places you should visit. HubSpot Academy is one of the places you cannot forget. We're also happy to help you get started with reporting.

Share this

Best Practices to Extend HubSpot CRM with Custom Properties & Objects

How the HubSpot CRM works